Thing Model
A Thing Model defines reusable device fields and the Web/App chart pages that are generated from those fields. Device templates can reference a Thing Model so devices of the same type share the same data structure and visualization configuration.
1. Description
- Go to Device Onboarding > Thing Model to open the Thing Model management page.
- A Thing Model usually represents a real device type, such as a temperature and humidity sensor.
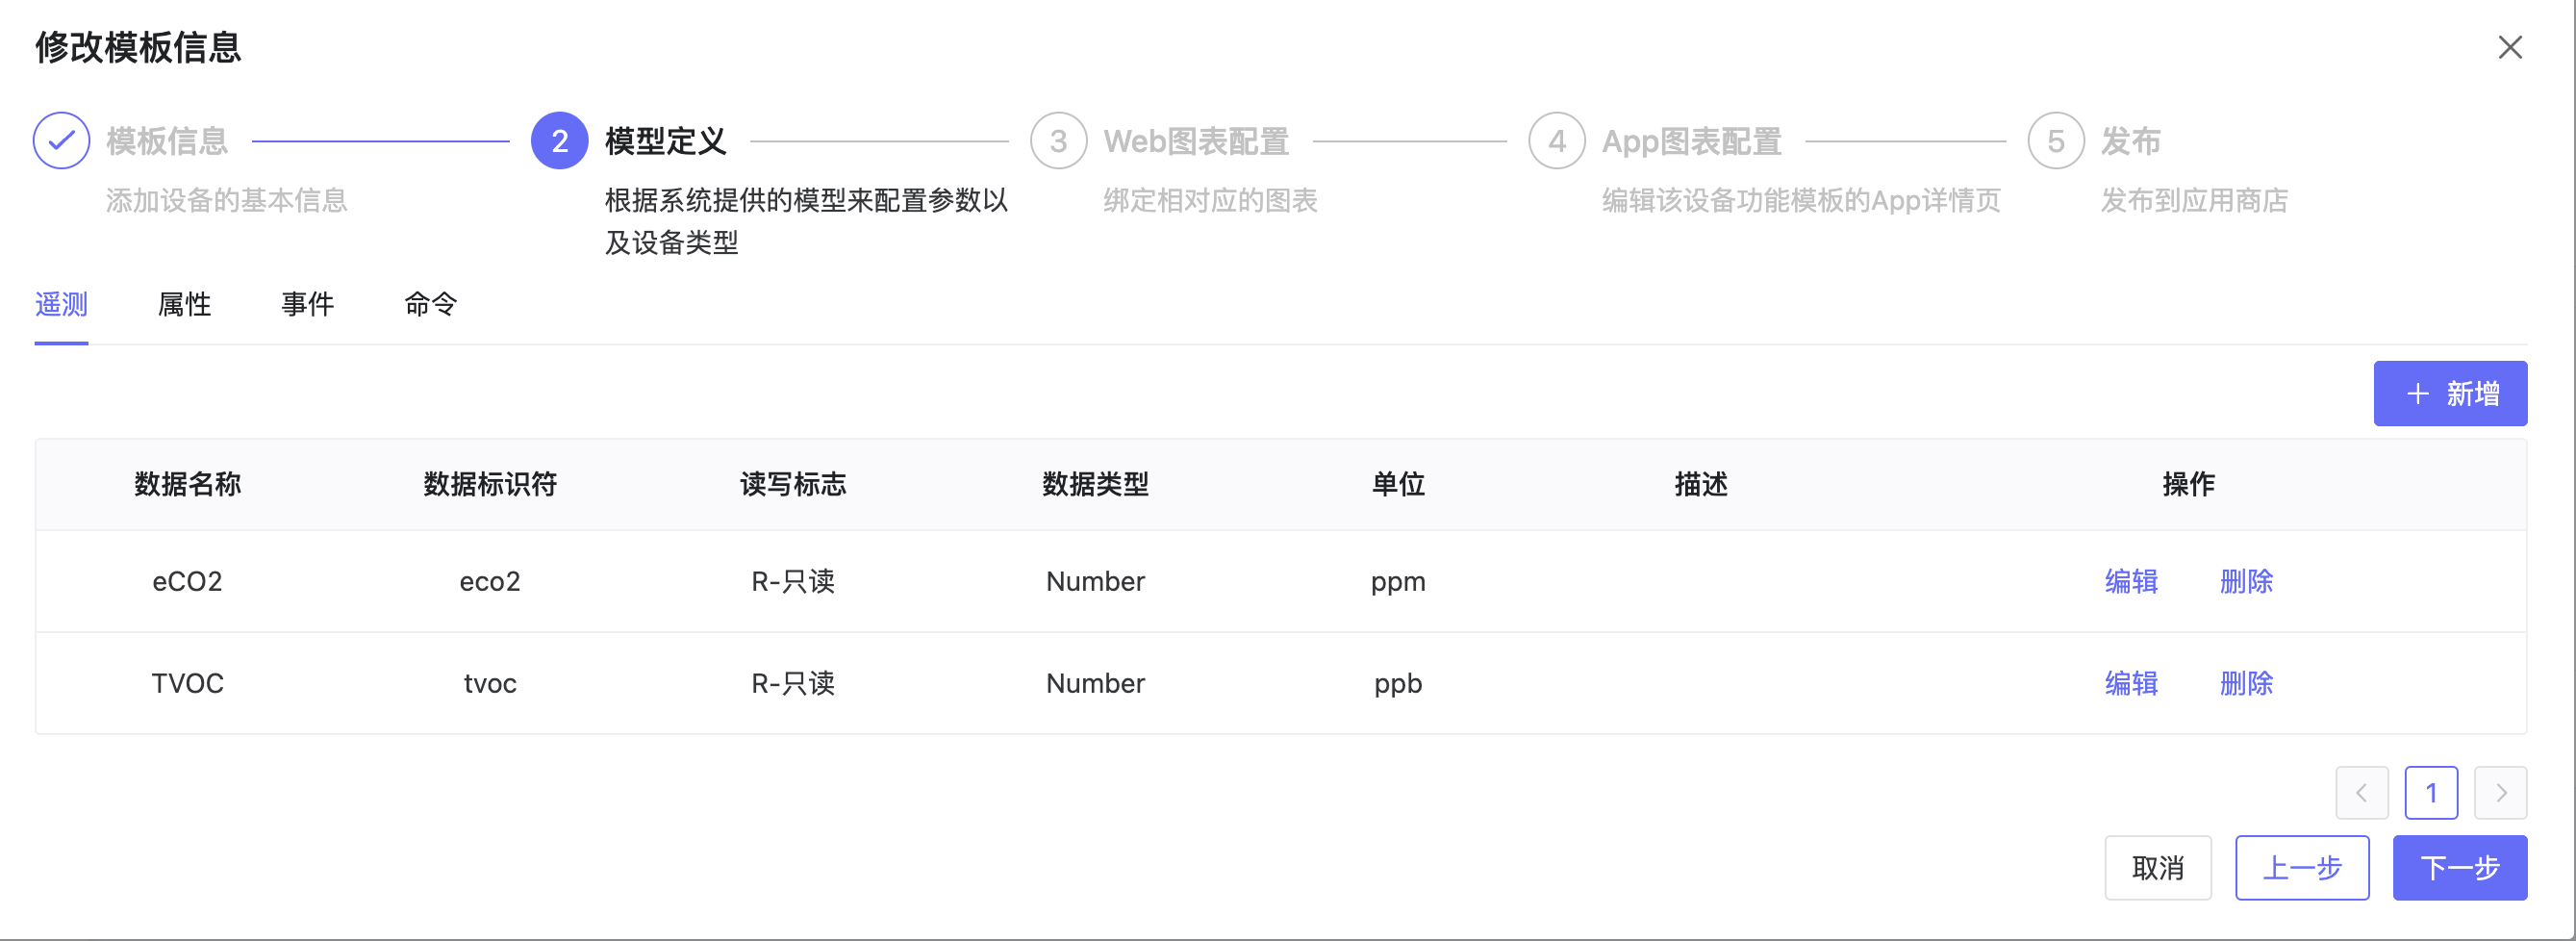
- The model definition contains telemetry, attributes, events, and commands. These fields can be used as data sources in chart configuration.
- Web Chart Configuration and App Chart Configuration use the ThingsVis editor to create previewable visualization pages.
- The saved chart configuration is applied when devices using this model display their details page.
2. Operations
2.1 Create a Thing Model
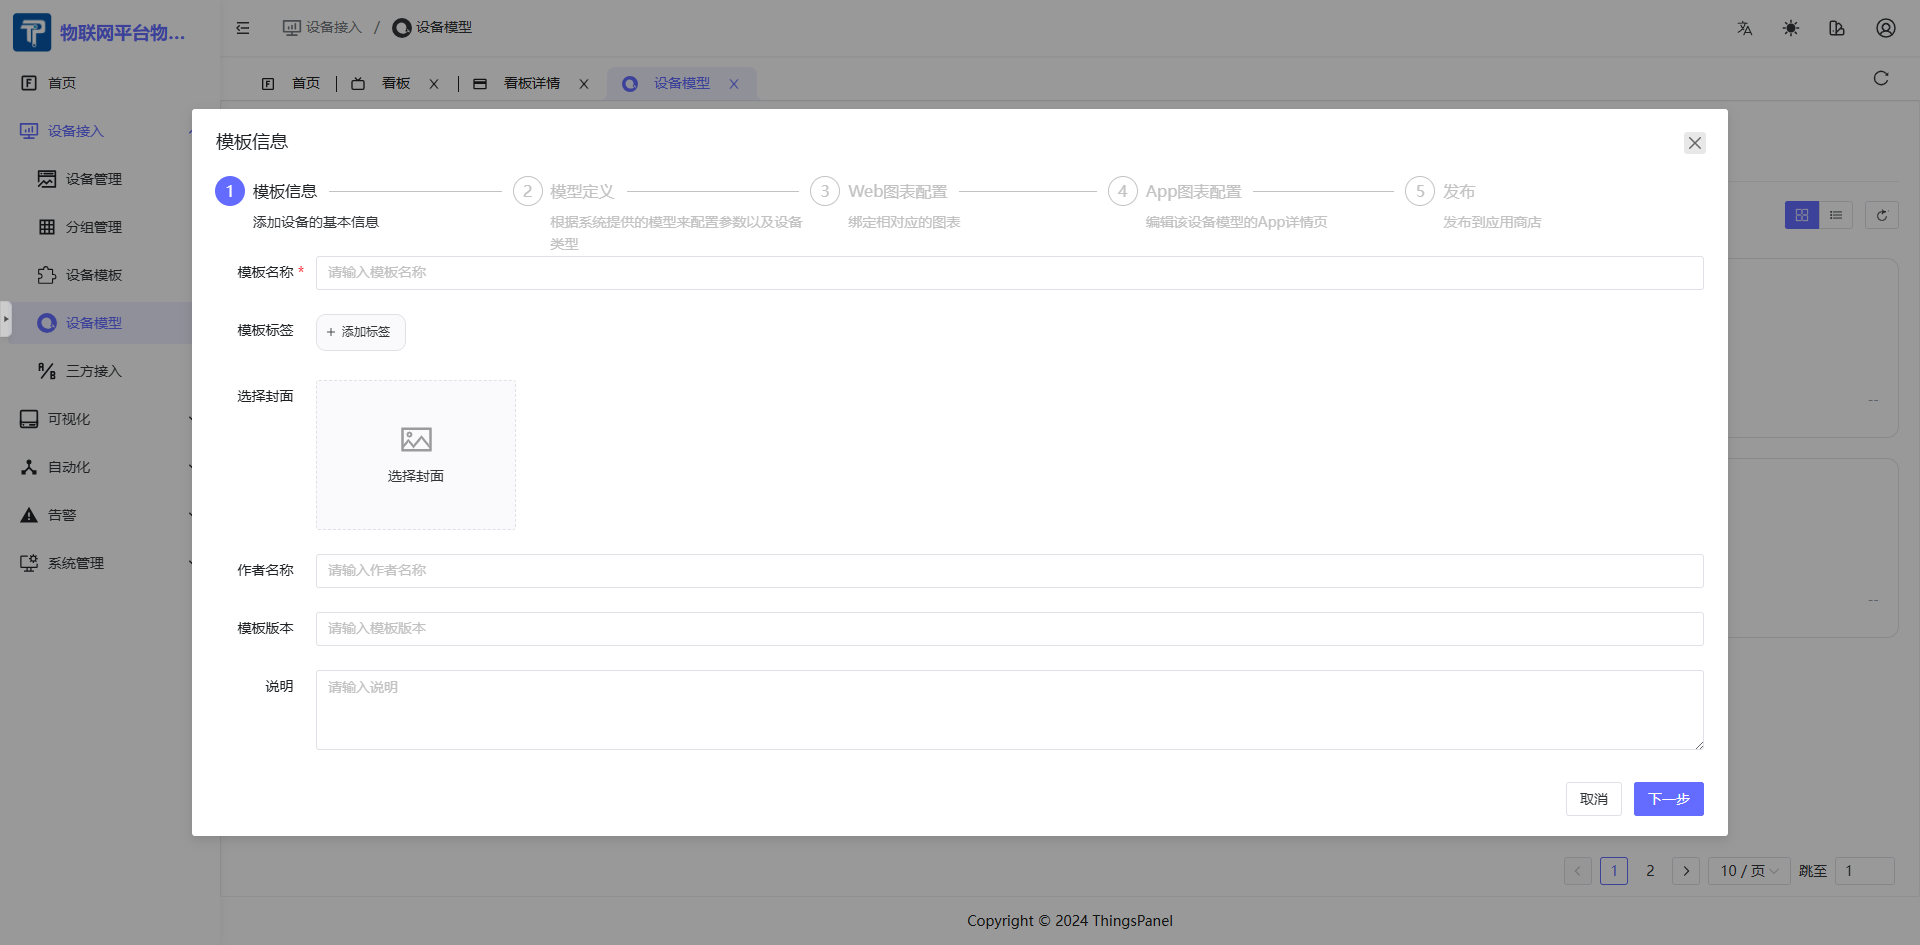
- Click Add Thing Model.
- Enter the name, tag, author, version, description, icon, and other basic information.
2.2 Define the Thing Model
- Configure the data name, identifier, data type, unit, description, and read/write settings for telemetry and attributes.
- Configure events and commands when the device needs event reporting or platform-issued control instructions.
- Save the model definition before entering the chart configuration steps.
2.3 Configure Web Charts
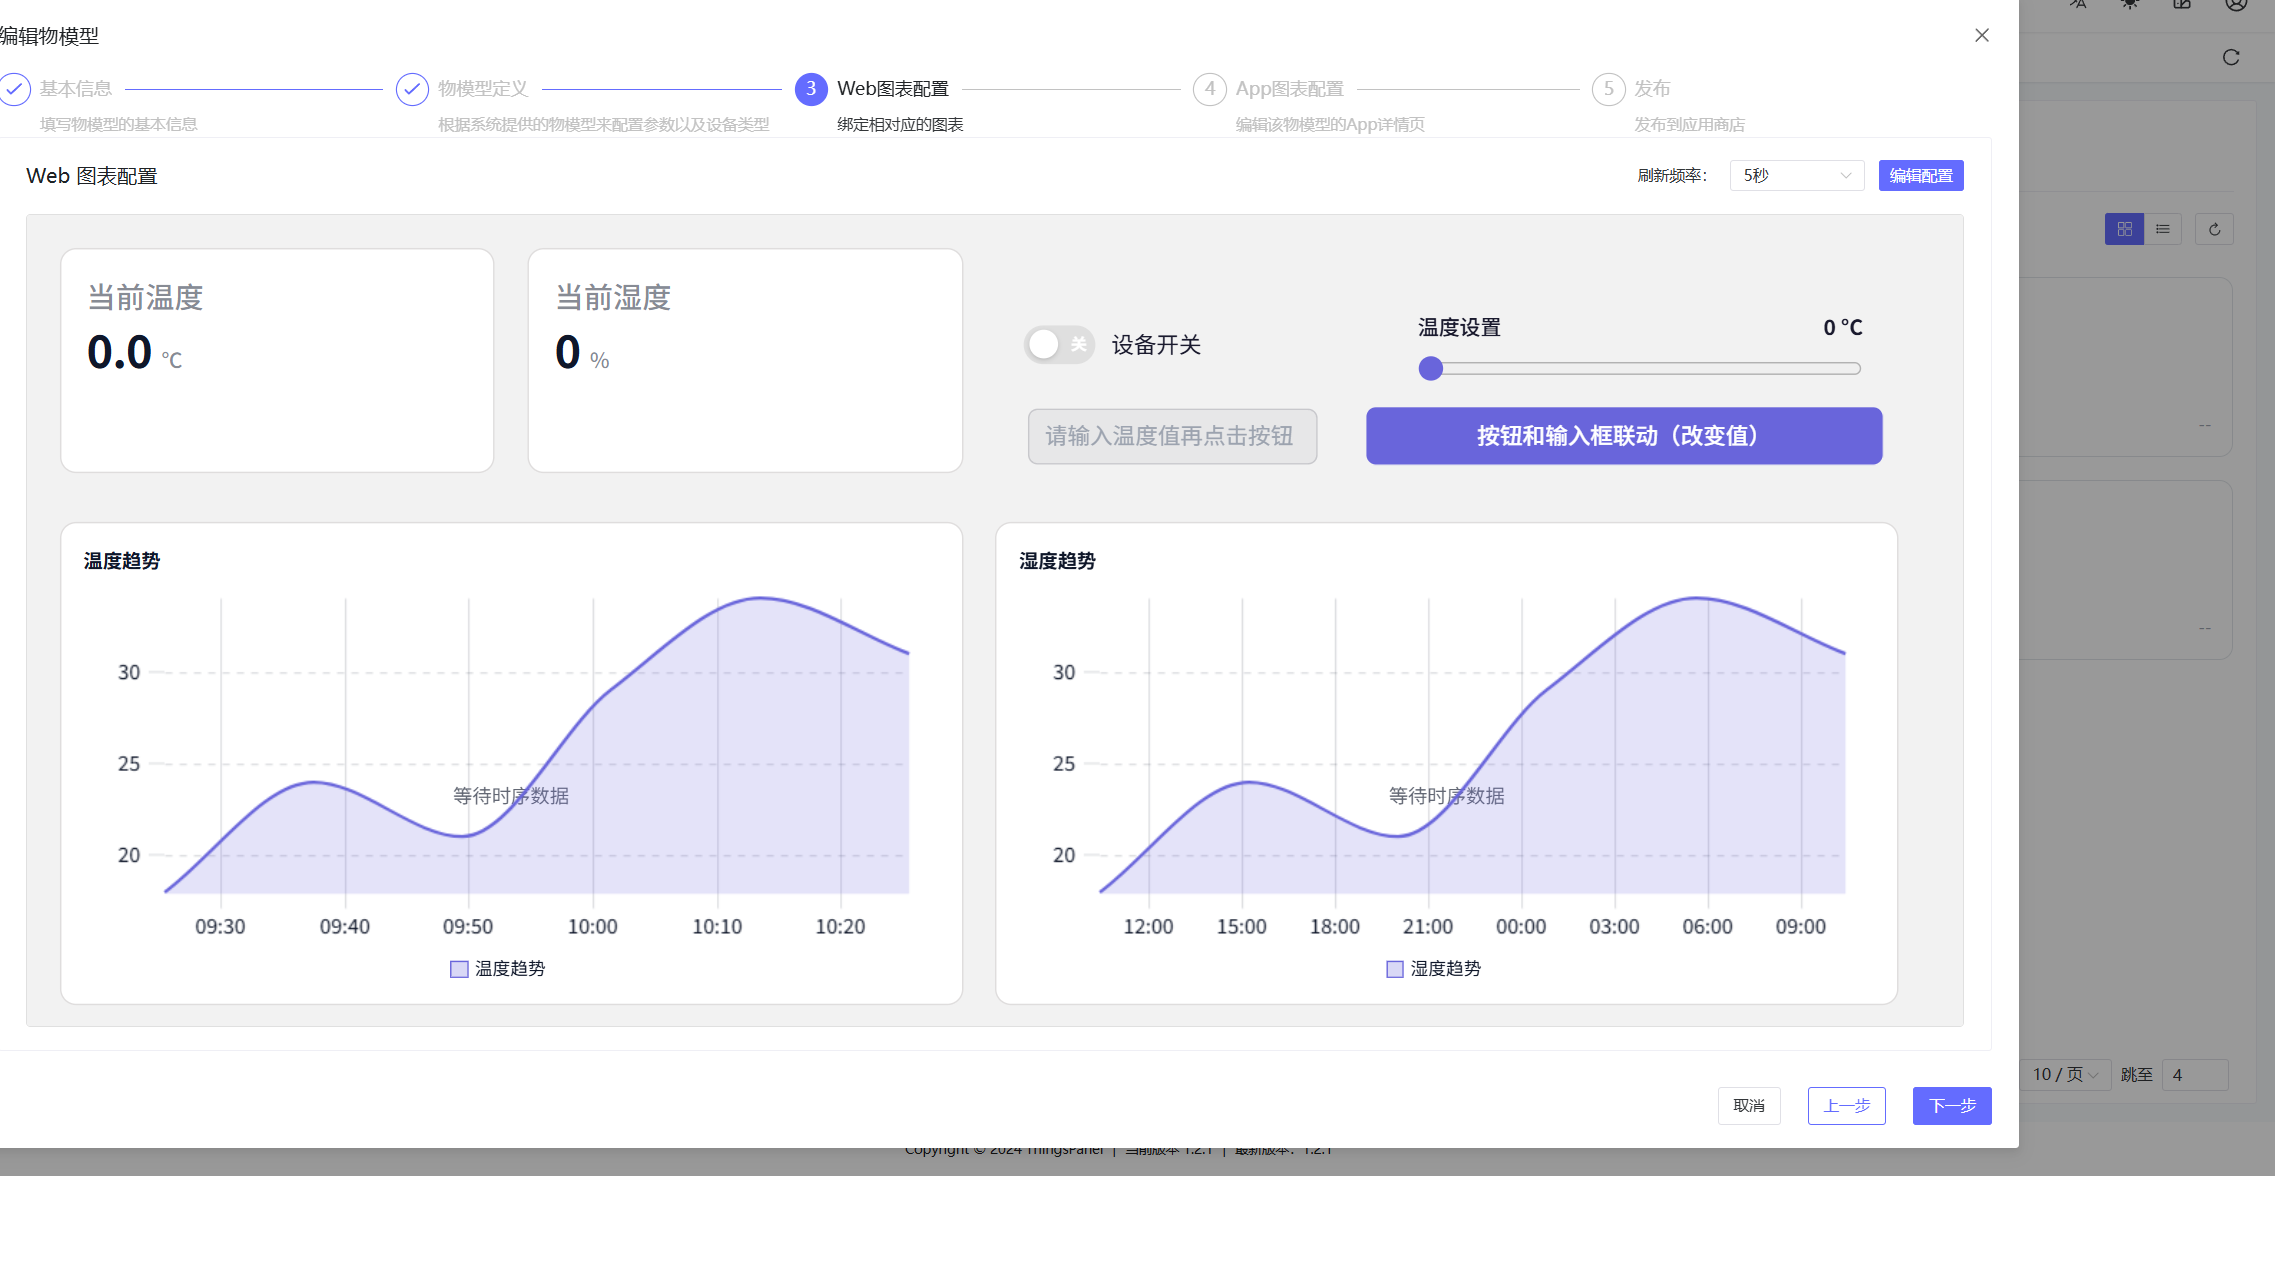
The Web chart step is configured through the embedded ThingsVis preview and editor. The Thing Model Configuration DEMO shows the current workflow.
- In the edit dialog, go to step 3 Web Chart Configuration.
- Select the refresh interval at the top of the card. In the DEMO, the interval is set to 5 seconds.
- The center area displays the current Web chart page as a ThingsVis preview. In the DEMO, it includes temperature trend, humidity trend, device switch, temperature setting, current temperature, and current humidity widgets.
- Click Edit Configuration to open the ThingsVis editor.
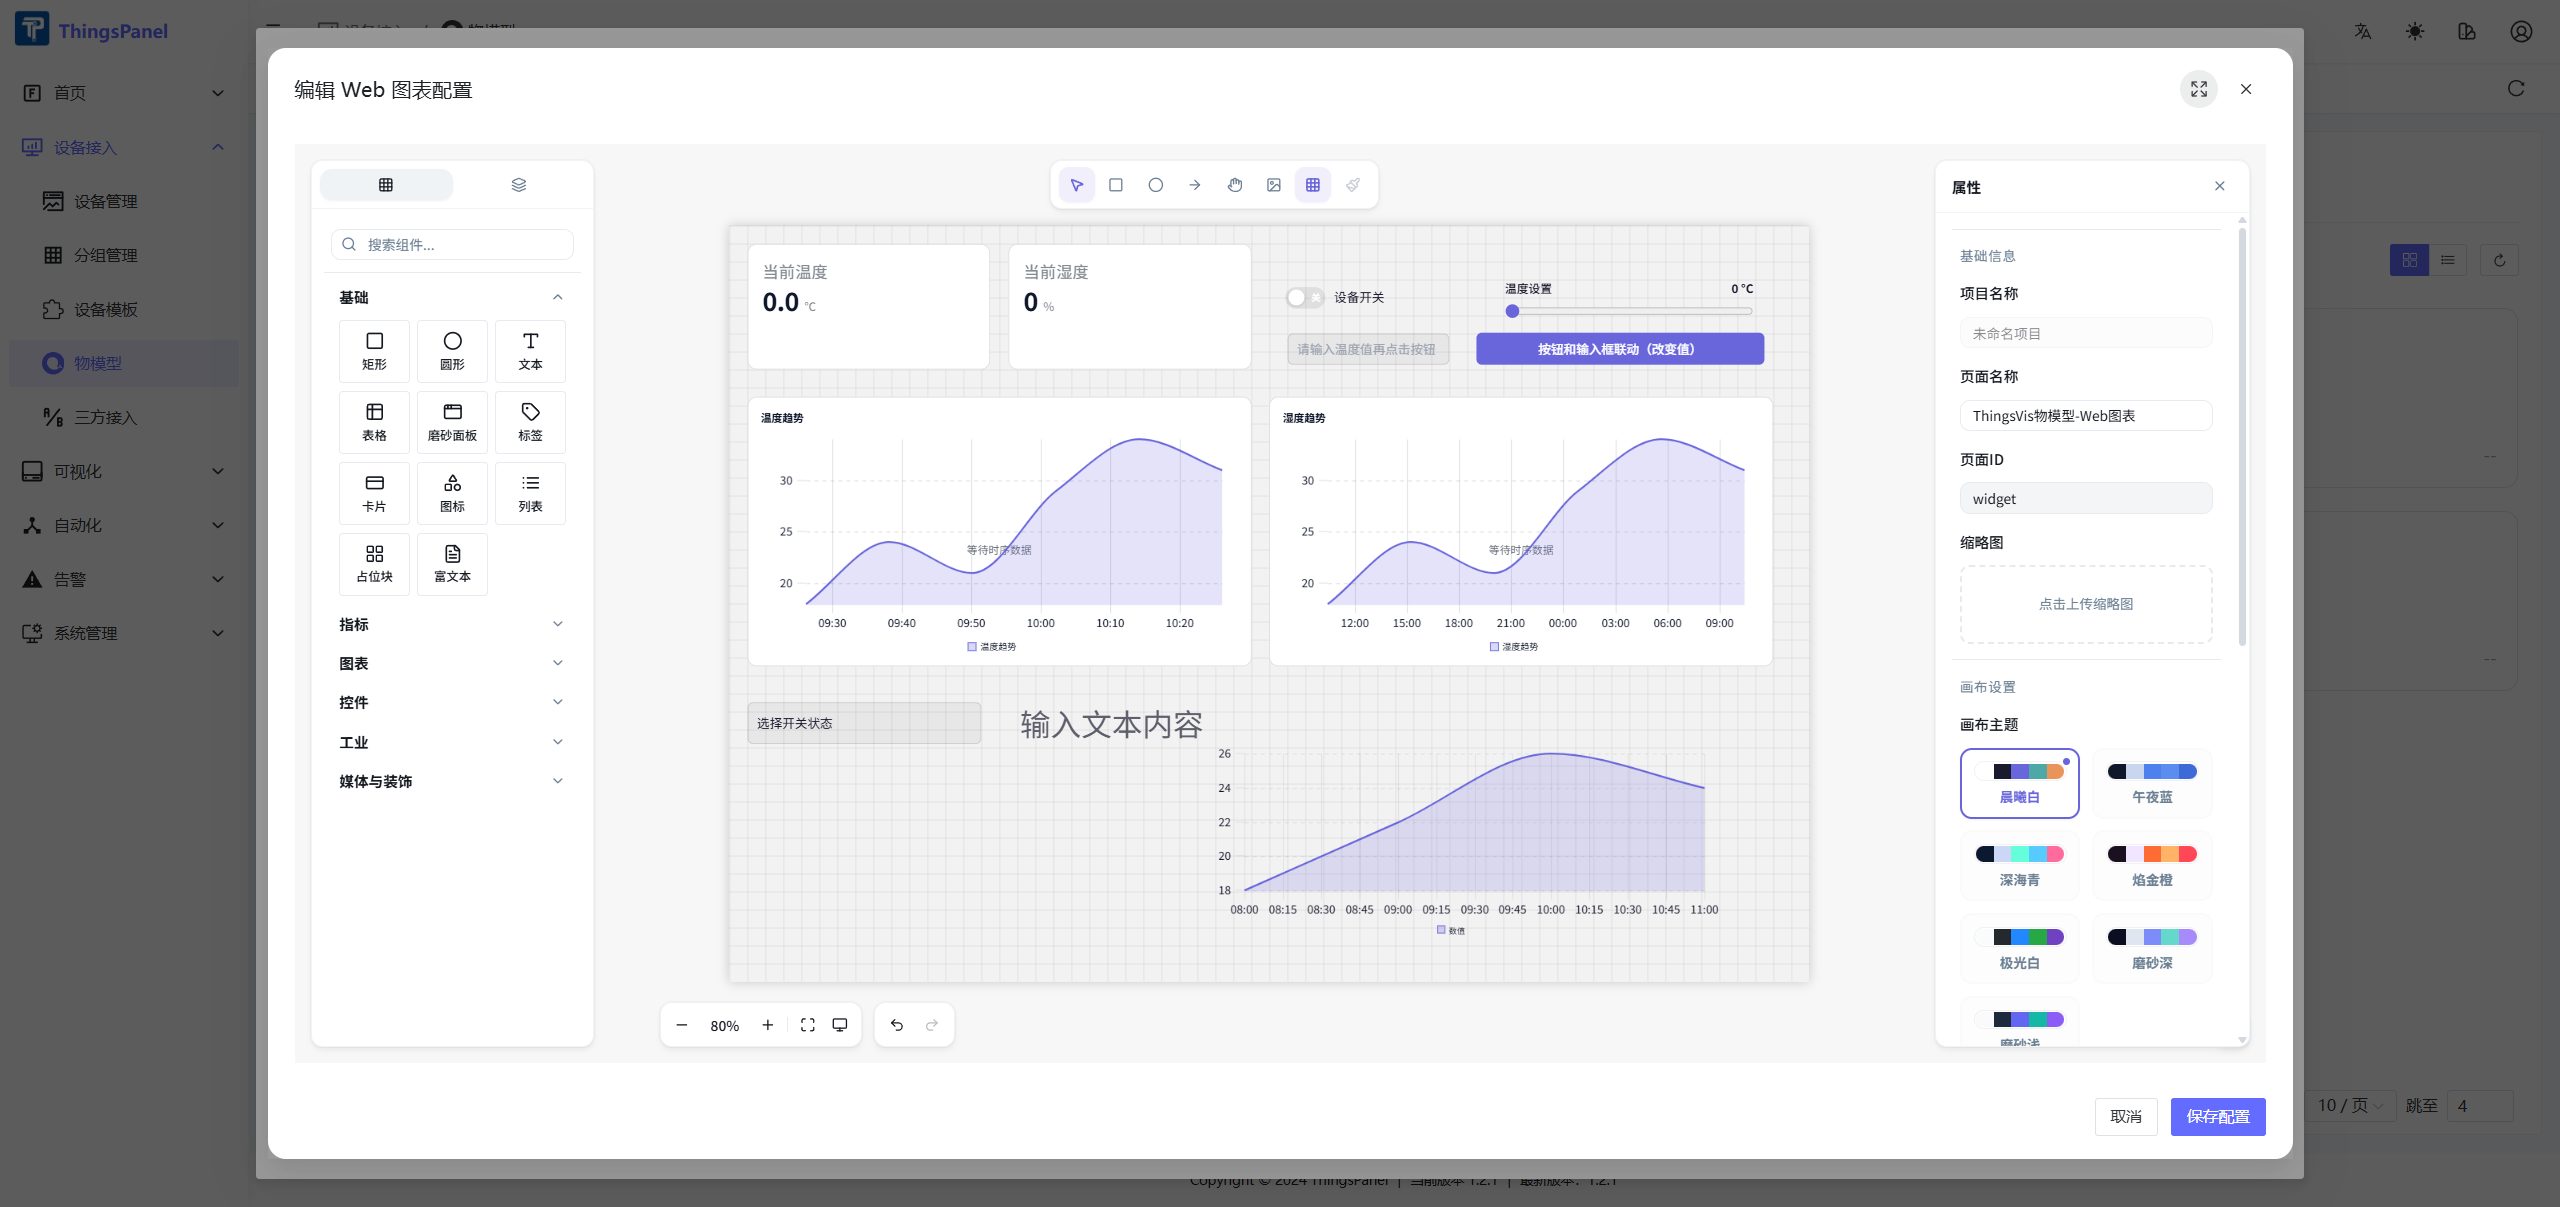
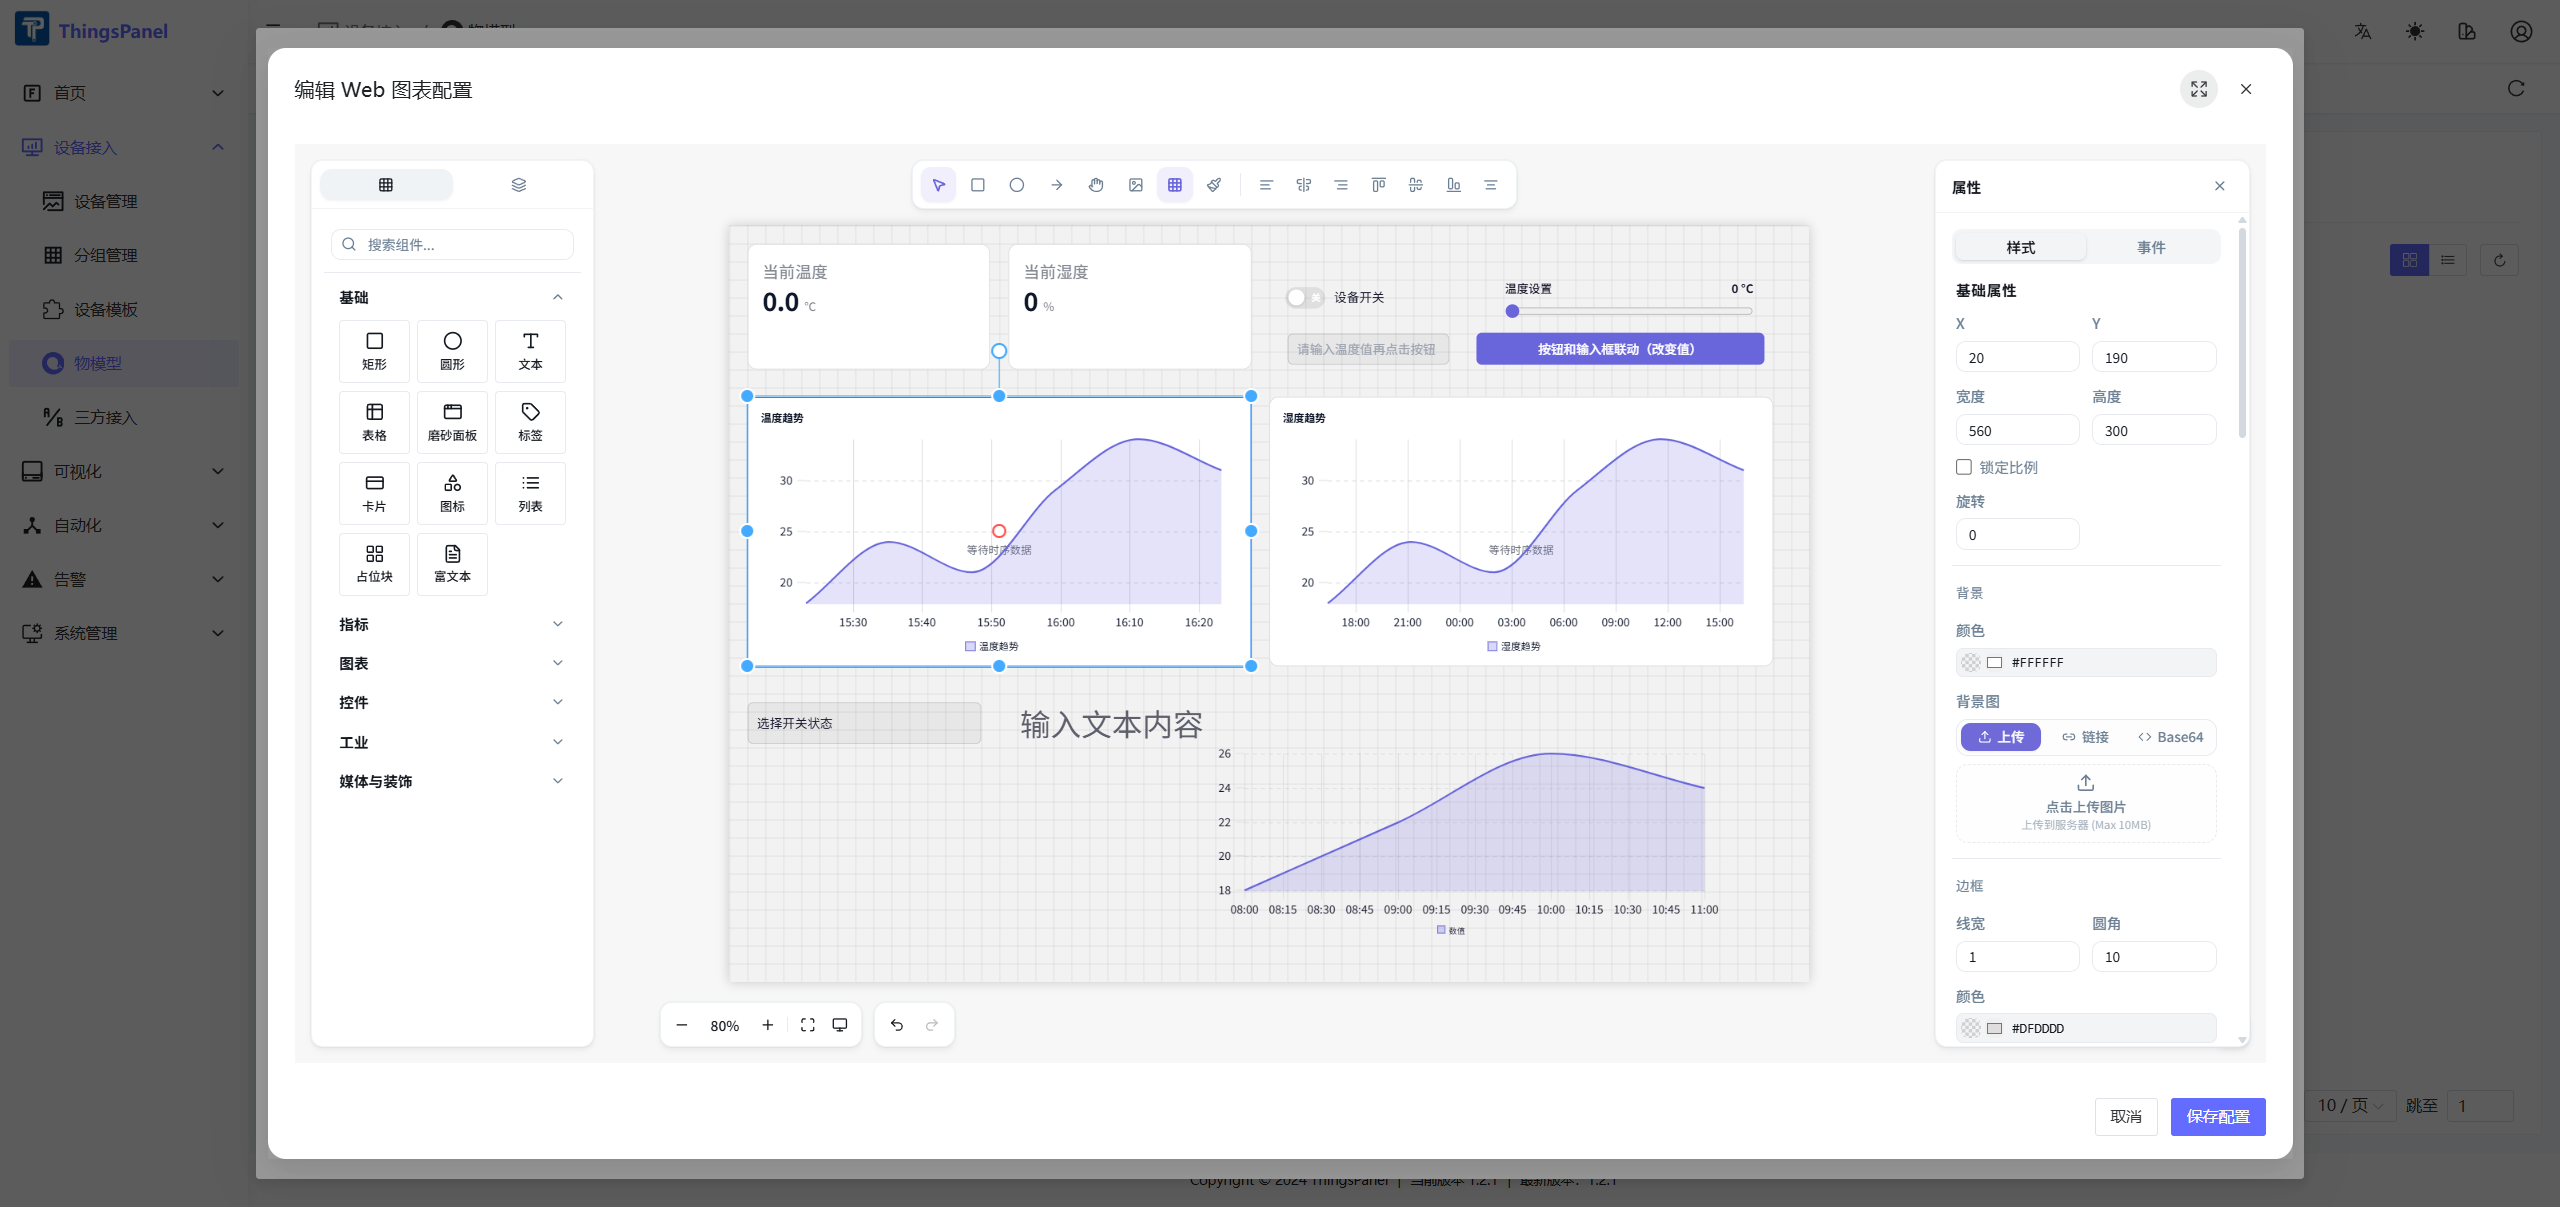
- In the editor, use the left component library to add widgets, adjust the canvas in the center, and configure the selected page or widget in the right property panel.
- When binding data, select the fields from the current Thing Model, such as
temperature,humidity, andswitch. - Click Save Configuration to save the page back to the Web chart configuration. Click Cancel only when you do not want to save the changes.
- After saving, the Web chart step returns to the preview. Confirm the preview is correct, then click Next Step.
Data binding examples
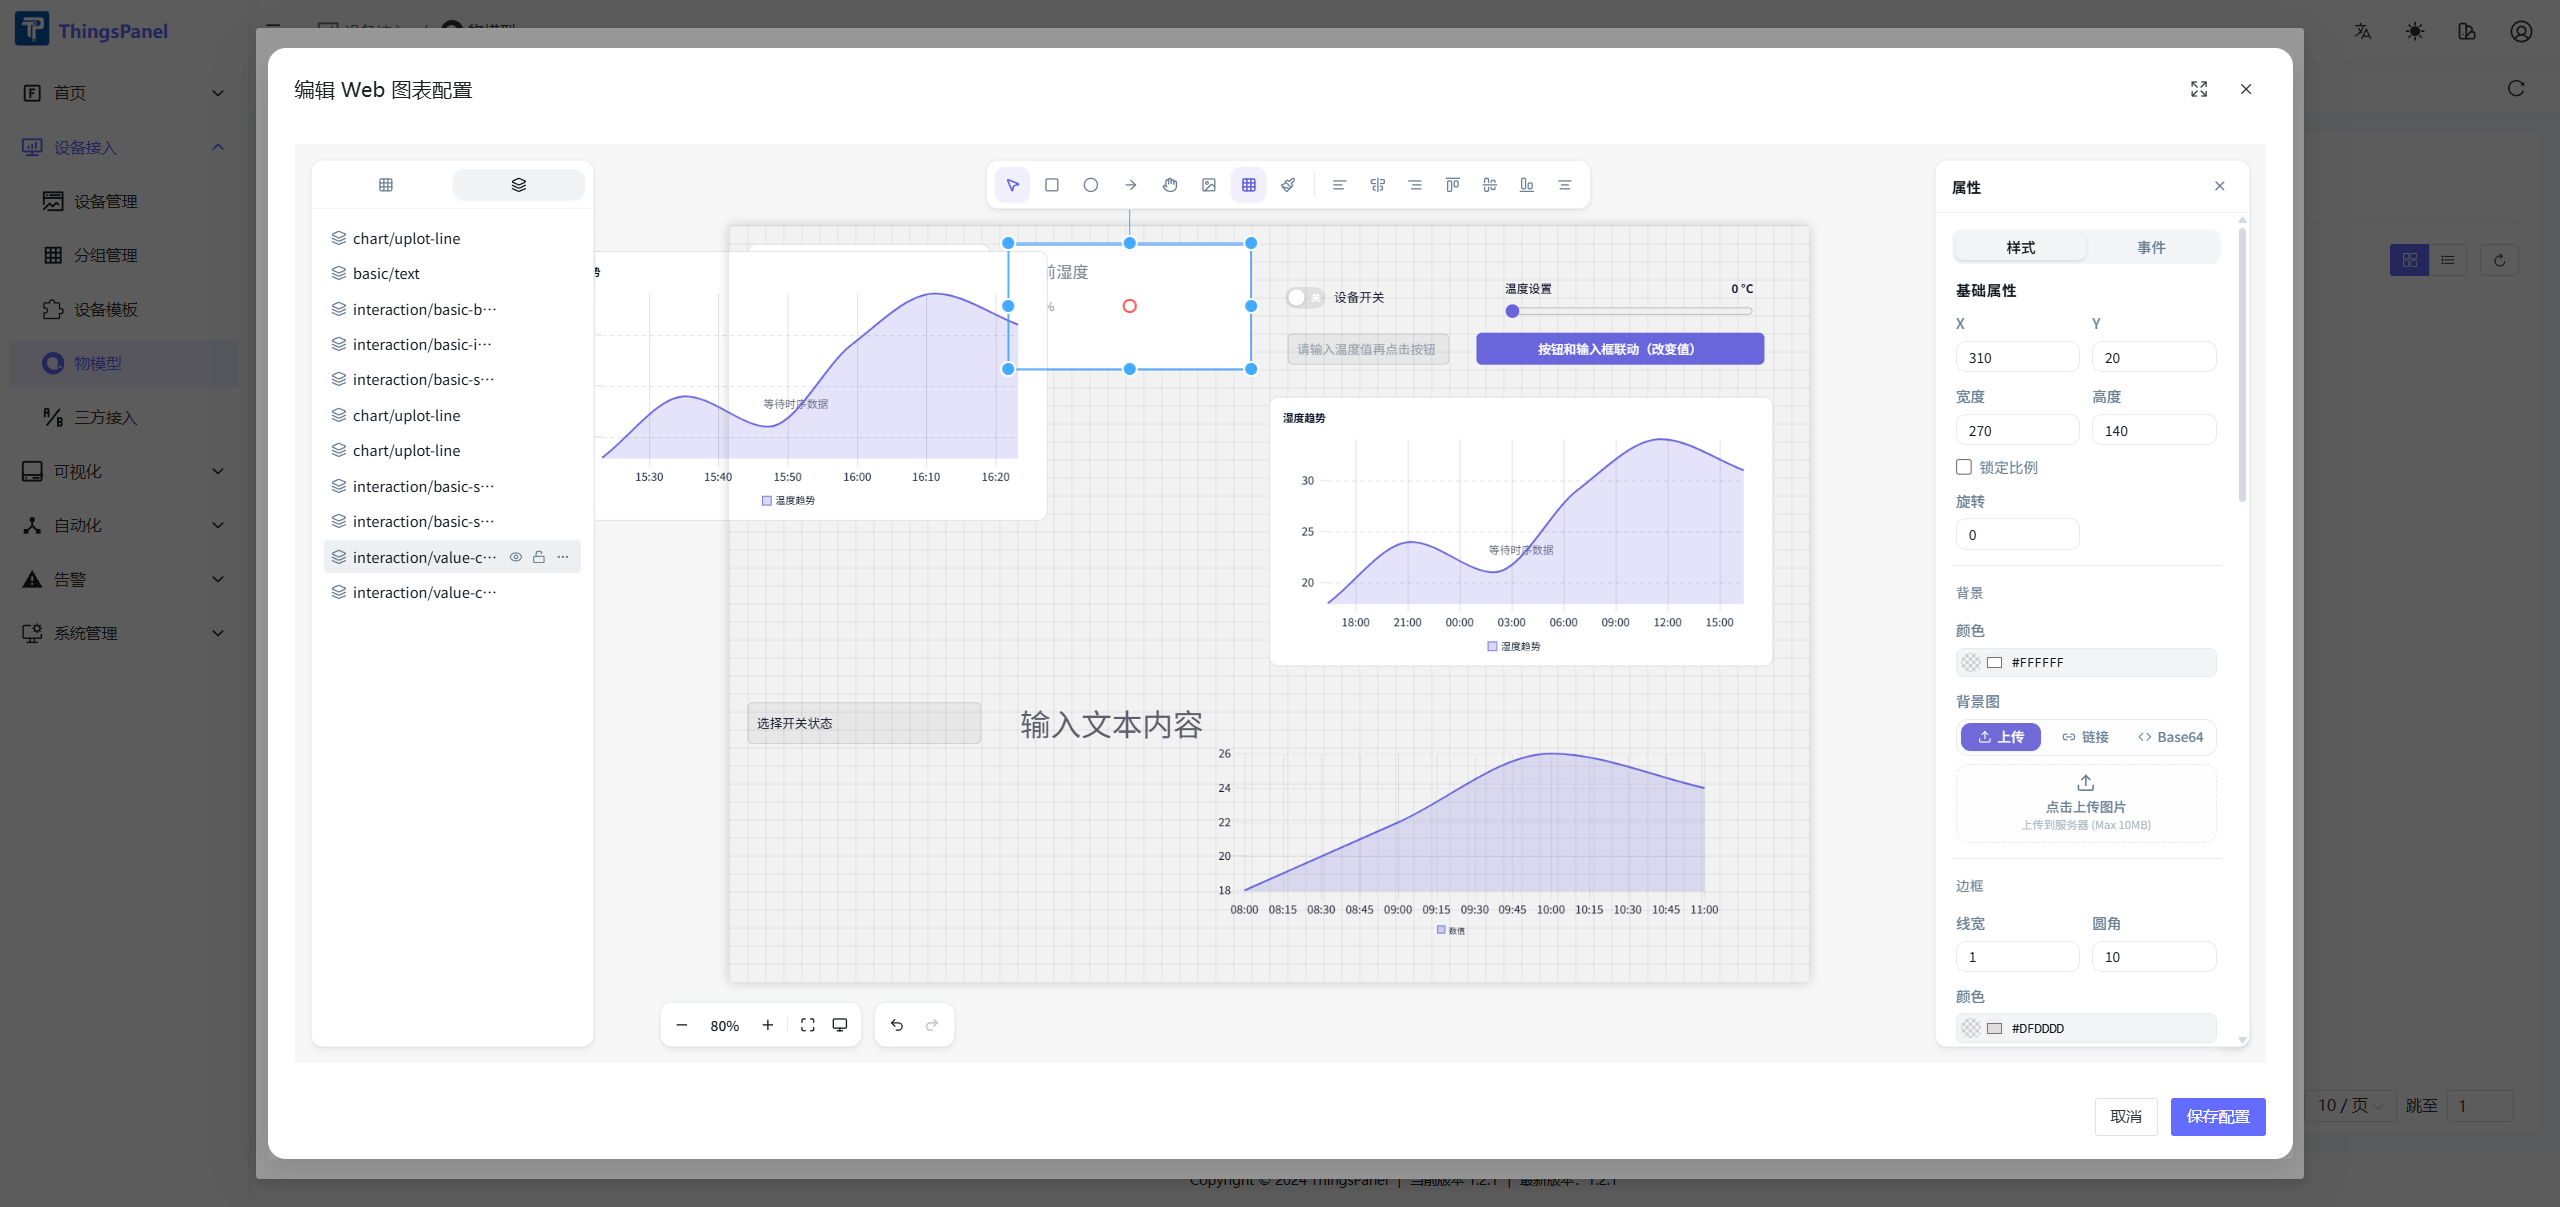
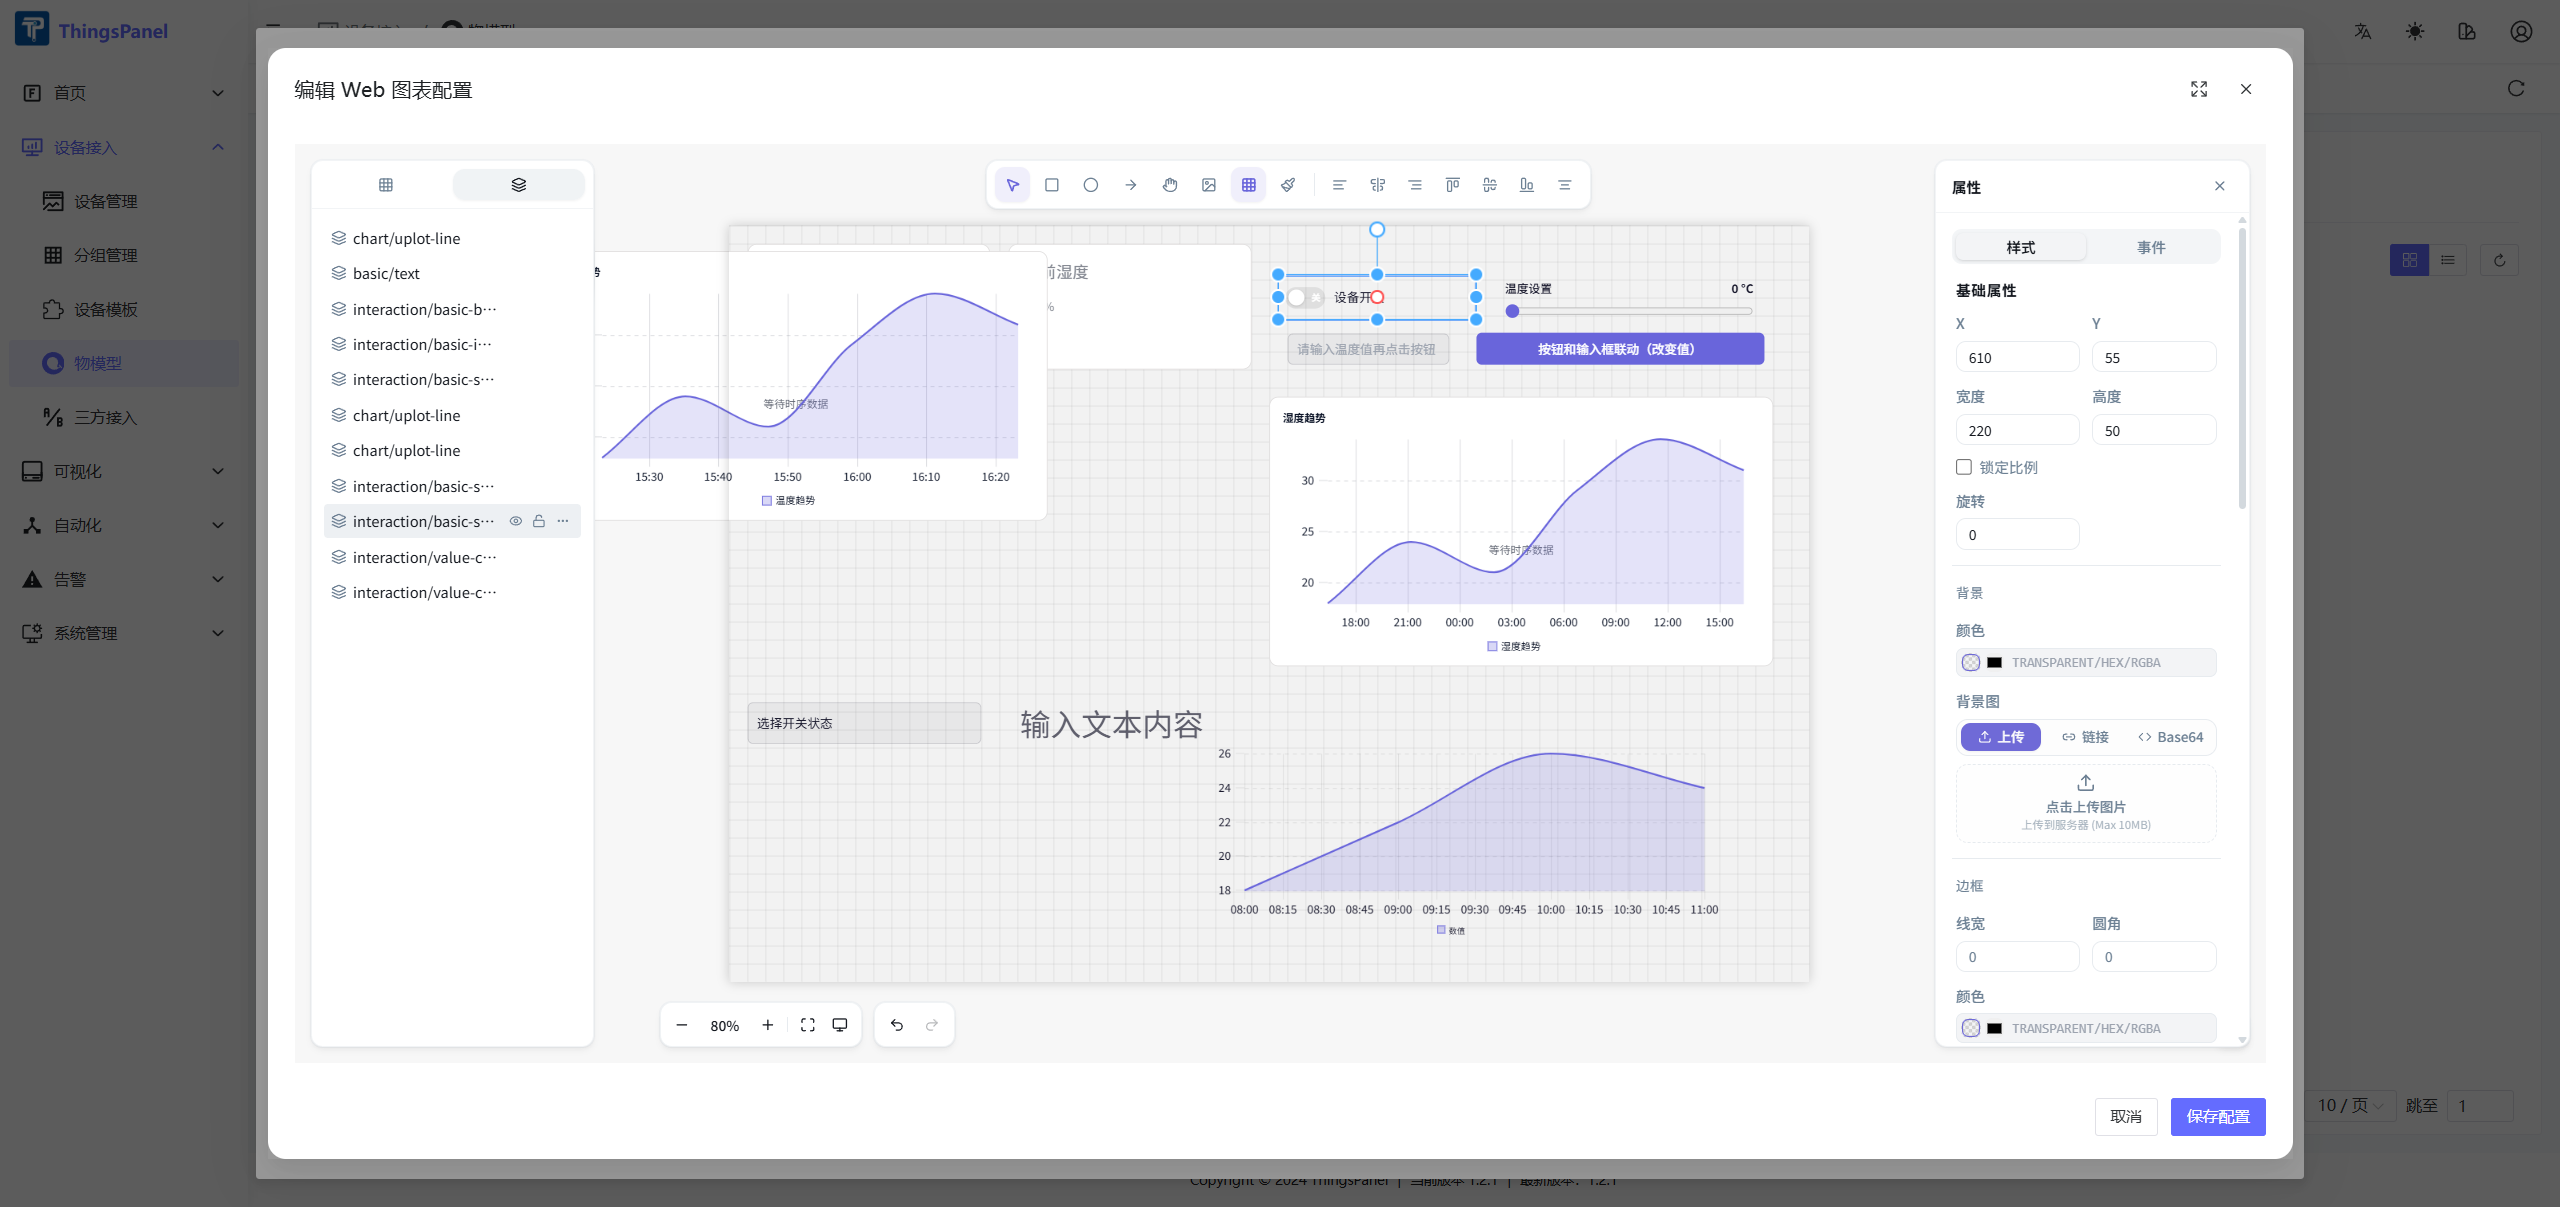
Select a widget on the canvas, or switch to Layers and select the target widget by name. The selected widget's binding options are shown in the right property panel.
For a trend chart, select a line chart widget, such as chart/uplot. In Content, configure the chart title and display options. In Data, set the dataset binding mode to Field, set Data Range to Device Data, set Data Type to Historical Data, and select a historical array field such as temperature__history or humidity__history. Configure the time range, aggregation function, aggregation window, smooth curve, and area fill as needed.
For a value card, select interaction/value-card. Set the card title, then set the value binding mode to Field. Use Device Data as the data range, Thing Model Field as the data type, and select a numeric field such as humidity or temperature. Configure the unit, whether to show the unit, the decimal places, and optional trend or icon display.
For a switch, select interaction/switch. Set Switch Status to Field, use Device Data as the data range, select Thing Model Field, and bind it to a Boolean field such as switch. Configure the label text, label position, on/off text, size, colors, and behavior options such as disabled state or confirmation before switching.
2.4 Configure App Charts
The App chart step also uses the ThingsVis editor, but the result is saved separately for the mobile App detail page.
- Go to step 4 App Chart Configuration.
- Select the refresh interval for the App detail page.
- Click Create Configuration or Edit Configuration to open the editor.
- Design the mobile detail page and bind widgets to telemetry or attribute fields from the Thing Model.
- Click Save Configuration to save the App chart page and return to the preview.
- Click Next Step to enter the publish step.
2.5 Complete and Publish
- Review the Thing Model information, model definition, Web chart configuration, and App chart configuration.
- Publish the model after confirming that the configuration is correct.